

Sometimes it's the most unexpected lines of code that contributes to slow performance. Take this line for example;
[this.heapArray[j], this.heapArray[k]] = [this.heapArray[k], this.heapArray[j]];
It's part of the function moveNode() and is a nice, succinct and readable way to swap two elements in an array, using the modern destructuring syntax.
Here's a performance benchmark comparison between heap-js - the package containing the moveNode function, and heap - a different package implemented differently but does the same thing.
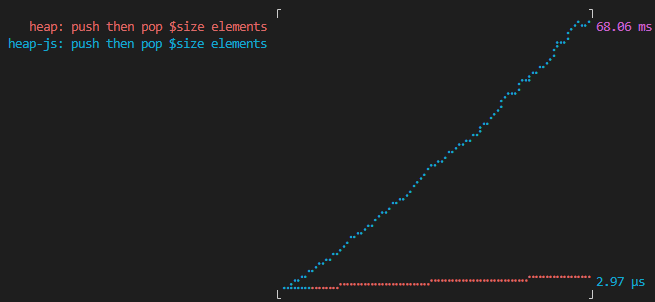
heap-js blows the time scale for the same operations!!
Now let's change that one line to this good old fashioned temp-variable approach:
    const temp = this.heapArray[j];
    this.heapArray[j] = this.heapArray[k];
    this.heapArray[k] = temp;
and let's re-test the performance comparison:
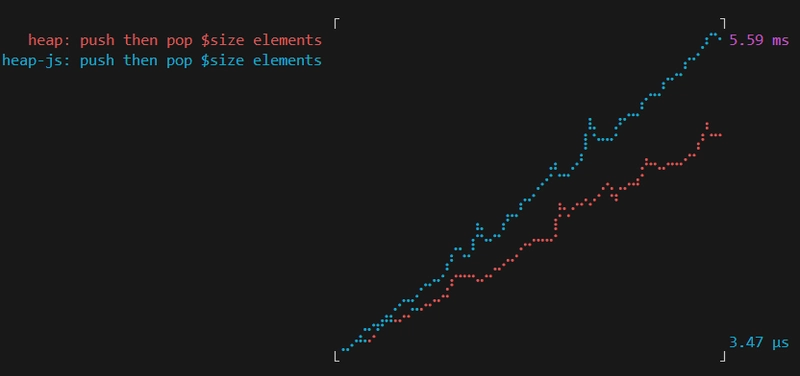
Wow!! We went from 68.08ms for the highest x-value to 5.59ms?!
How?
Now's my time to preach about profiling 🔍. Profiling gives insights to which parts of your program takes up most time. These are usually visualized in three different ways;
1) Table summary (VS Code, Python's CProfile...)

2) In-line (IntelliJ, Chrome devtools > source tab)

3) Flame graph (IntelliJ, VS Code)

I find the latter two most helpful, and in fact, the culprit from before is actually in the second image! Let's look into this mysterious line:
while ((n === void 0 || n-- > 0) && !(r = i.next()).done) ar.push(r.value);
Honestly, a lot of this is confusing to me too since this is the output of rollup, however the key part is the .next() method call. I'm familiar with this from the Iterator interface! Iterator is an interface that defines a generic way of looping over (or iterating) over items. However, it adds some overhead and in a lot of cases it's a lot slower than just indexing into an array (that's just one pointer lookup).
But how does this relate to this line of code? We're not iterating over anything are we?
[this.heapArray[j], this.heapArray[k]] = [this.heapArray[k], this.heapArray[j]];
Well in fact... The mysterious line of code is inside the function __read():
    var __read = (undefined && undefined.__read) || function (o, n) {
        var m = typeof Symbol === "function" && o[Symbol.iterator];
        if (!m) return o;
        var i = m.call(o), r, ar = [], e;
        try {
            while ((n === void 0 || n-- > 0) && !(r = i.next()).done) ar.push(r.value);
        }
        catch (error) { e = { error: error }; }
        finally {
            try {
                if (r && !r.done && (m = i["return"])) m.call(i);
            }
            finally { if (e) throw e.error; }
        }
        return ar;
    };
and taking a look at the moveNode function, we see that it calls the __read() function!
        Heap.prototype._moveNode = function (j, k) {
            var _a;
            _a = __read([this.heapArray[k], this.heapArray[j]], 2), this.heapArray[j] = _a[0], this.heapArray[k] = _a[1];
        };
Conclusion
Profiling is important!! You can often make educated guesses on where performance bottlenecks are, but compilers will sometimes surprise you. It's therefore essential to objectively measure your program before making changes, whether that is with profiling your code before and after, or creating a suite of benchmarks that show an improvement between before and after your changes. Remember; without an objective, measurable goal, you're walking around blind.
I would love to answer why the generated output is so inefficient when using the array destructuring syntax, but this would be out of the scope of this post. My guess would be that it's because of compatibility and that the Rollup (the bundler used in heap-js) uses a generic way of interpreting and outputting code for destructure assignments.
On a final note; this type of performance, although seemingly significant, is not something the average developer needs to think about, because I would argue that readability and maintainability of code is almost always preferable. This obviously depends on the project you're working on, but most of the time, if the code base is already littered with [a, b] = [b, a], then be consistent and stick to that. You probably do not need this extra performance;)