IP visualizer is a tool for visualizing IP addresses on a map inside a selected area determined by a circle drawn by the user.
I got the inspiration for this project while I was working on a different project (closed source) and was researching the Redis possibilities, especially the ones tied to GEO stuff.
After finishing that project I noticed the post here on DEV about the Redis hackathon and got the idea to use the Redis GEORADIUS command to fetch IP-addresses (data provided by the MaxMind geolite2 database that I have worked with before on my IpInfo project) inside a circle and then visualize those IP-address on a map.
Frontend is built with Svelte (just for the simple reason i enjoy using Svelte). It uses MapLibre for the map, Deck.gl for data visualization and Pico.css for styling. I usually write all CSS by myself but I don't enjoy it, especially not when it comes to styling forms so here I wanted to save time and try something new and my choice was Pico.css
Backend is a Node Express API. It uses the following common modules.
Helmet (security headers)
Cors (cors support when developing)
Joi (validation)
Dotenv (configuration)
Compression (gzip support)
Express-async-errors(monkey patch routes so don't need try catch)
Express-rate-limit(rate limiter)
Rate-limit-redis (Redis store for express-rate-limit)
Node-redis (Redis client)
The backend also have some modules I written myself for logging, error handling, etc...
The download scripts have a bunch of dependencies too.
Download (download and extract files)
Csv-reader (makes reading csv files ez)
Fs-extra (makes file and directory handling easier)
readline-sync (makes it ez to read user input)
Many of these dependencies are just to make development easier, for sure you can use native node features to read input, download files and so on but well, those libraries was made for a reason, simplify development and not having to "reinvent the wheel" every time.
Simply click on the crosshair button to activate select mode. Click anywhere on the map and drag to select a radius.
To cancel out of selection mode without drawing simply right click or press escape button.
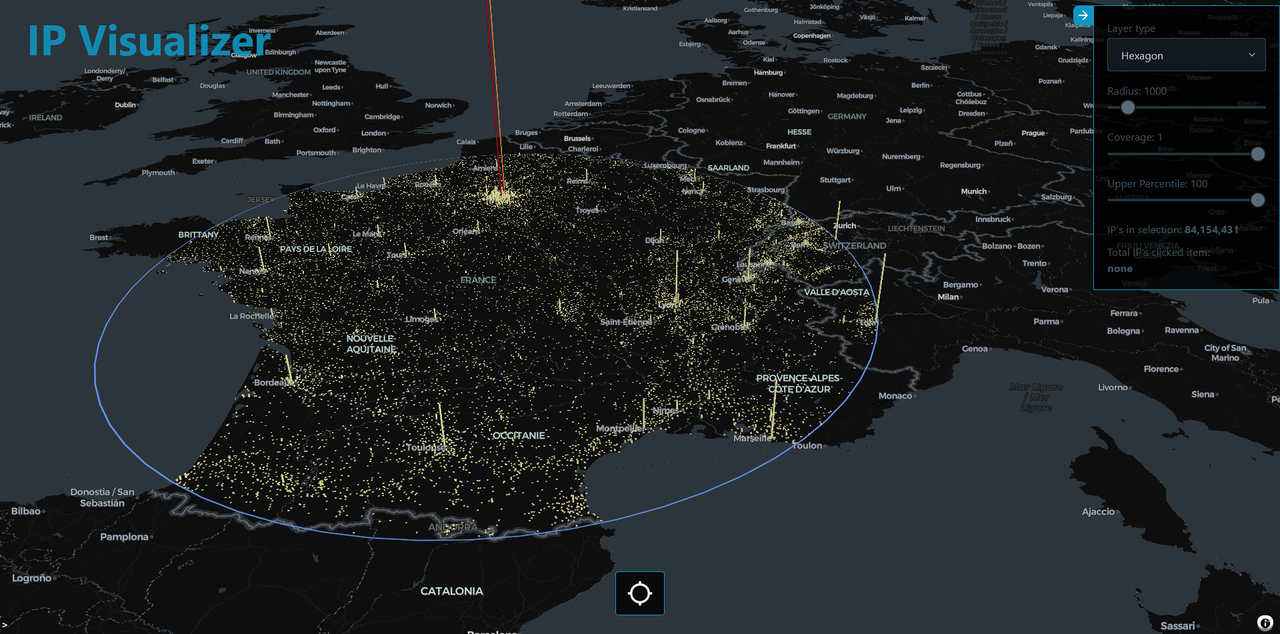
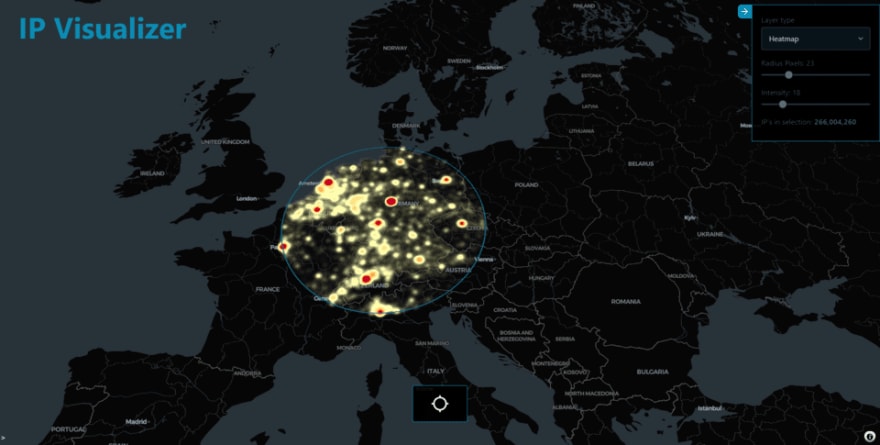
When finished selecting the area, data is fetched and visualized on the map. The layer controller allows the user to switch between the different visualization layers and options.
In some layers you can click on an entity to see more information.
Overview video
Here's a short video that explains the project and how it uses Redis:
How it works
The user activates the select mode by clicking the crosshair button.
When this mode is selected the mouse position will be captured when the…


Looking great! 🔥