Articles by Tag #grafana
Browse our collection of articles on various topics related to IT technologies. Dive in and explore something new!


Monitoring Your App with Prometheus and Grafana
"If you can't measure it, you can't improve it." Peter Drucker Table of...


Getting Started with Prometheus and Grafana in Java
Monitoring is a crucial aspect of application performance management. As applications scale, ensuring...


Five Open Source tools to track your PostgreSQL database performance
Monitor your feature’s performance impact with Prometheus, Flagsmith and Grafana. Use these Open Source tools to confidently keep an eye on your database's health and make an informed decision.


Bring Data to Life: How to Install Grafana on Ubuntu 22.04
Monitoring and visualizing real-time data has become crucial for businesses to make data-driven...


Complete Guide to Automate the Deployment of the Sock Shop Application on Kubernetes with IaC, CI/CD, and Monitoring
This project is about deploying a microservices-based application using automated tools to ensure...


Prometheus + Redis: Simple Guide to Monitor Redis Instances
Redis is often a critical part of modern infrastructure — whether used as a cache, message broker, or...


Introducción a Grafana
Una guía completa para principiantes sobre la instalación e inicio con Grafana en macOS. ...


DevOps Made Simple: A Beginner’s Guide to Monitoring Kubernetes Clusters with Prometheus & Grafana
Introduction Kubernetes has become the backbone of modern cloud-native applications,...


EKS & NGINX Load Balancer Monitor with Prometheus, Grafana, and Alerts
Introduction: With the growing use of Kubernetes (EKS) and microservices architecture, monitoring...


How to add rate limiting to your API using TigerBeetle
You should always consider having explicit limits in place when building software. For online...


How to set up a system monitoring for linux server using node exporter, prometheus & grafana
Monitoring your Linux VPS is essential to track system performance and prevent potential issues. In...


Docker with Prometheus and Grafana: Real-Time Monitoring Simplified
Docker with Prometheus and Grafana: Monitoring Made Easy Prometheus and Grafana are...


Grafana Architecture Explained: How the Backend and Data Flow Work.
Grafana is a powerful open-source tool that helps turn raw data into clear, interactive dashboards...


Open Source Load Testing with k6, Docker, Prometheus, and Grafana
Introduction Load testing is crucial for ensuring your applications can handle expected...


Integrating SafeLine WAF Syslog with Prometheus and Grafana
SafeLine WAF offers a powerful logging capability through Syslog, which enables integration with a...


Day 36: Monitoring Kubernetes with Prometheus and Grafana
In modern Kubernetes environments, effective monitoring ensures cluster performance and system...


Application Tracing With Golang, OpenTelemetry, and Grafana Tempo
Trace Trace is a record or history from a request. Trace give us big picture abour what is...


AWS Managed Grafana Service
Amazon Managed Grafana Amazon Managed Grafana is a fully managed Grafana service that is scalable,...


Grafana K6 cheat sheet: everything a performance engineer should know
Grafana K6 Cheat Sheet: Everything a Performance Engineer Should Know (with Examples and...


Observability on Amazon EKS Cluster: A Complete Guide to Prometheus and Grafana with Helm
When deploying applications on Amazon Elastic Kubernetes Service (EKS), ensuring that you can...


Golang com Opentelemetry, prometheus, Grafana tempo OSS e Grafana padrão
📋 Descrição Este projeto é uma aplicação completa de monitoramento e rastreamento distribuído...
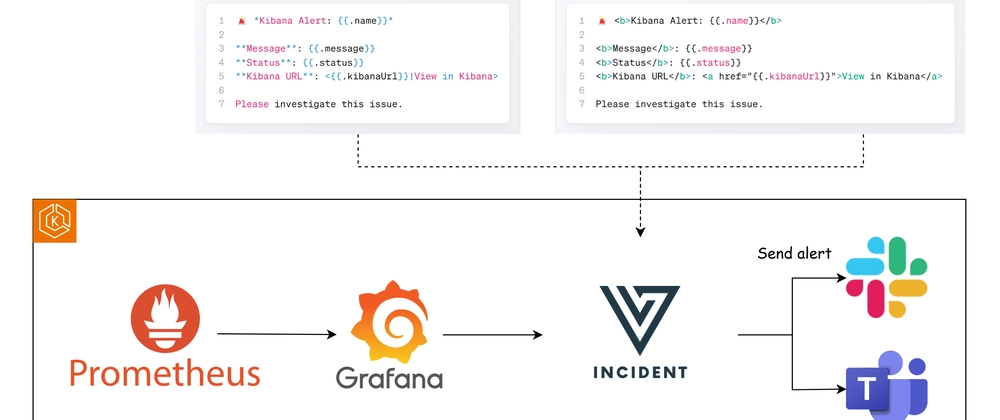

How to Configure Grafana to Send Alerts to Slack and Telegram
This guide leverages Versus Incident as an intermediary to route Grafana alerts to both Slack and...


Building a Local Observability Stack: A Journey with OpenTelemetry, ClickHouse, and Grafana
Hi everyone! My name is Alex and I'm a Backend Engineer. This article is my attempt to better...

Introduction to Grafana Cloud & Account Creation
1.What is Grafana Cloud? Grafana Cloud is a fully managed cloud-hosted observability platform ideal...
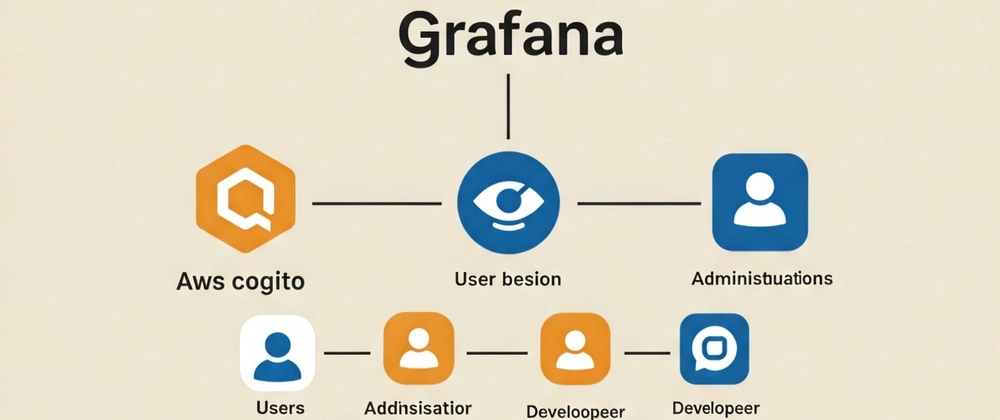

How to add custom org and role in grafana with AWS cognito as oauth provider
AWS Cognito + Grafana Idea To be able to configure the user to a given...


Setting Up Grafana for Monitoring .NET Apps with Docker
Grafana is an open-source analytics and monitoring platform that allows you to query, visualize, and...


PostgreSQL Monitoring: Real-time Query Insights with Prometheus and Grafana
Why Monitor PostgreSQL? PostgreSQL is widely used in production-grade systems, but performance issues...


Mengintegrasikan Microservices dengan Prometheus dan Grafana untuk Monitoring yang Efektif
Dalam dunia pengembangan aplikasi modern, arsitektur mikroservis telah menjadi pilihan utama karena...


Alert on counter discontinue in Grafana
Requirement We have a counter named heartbeat_count which indicates whether application...
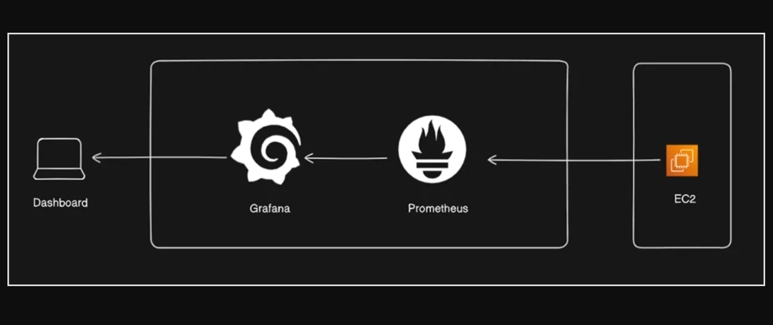

Monitor Your Static App memory usage EC2 Instances with Prometheus and Grafana
This blog post will guide you through setting up Prometheus and Grafana on a launched Ubuntu EC2...