Articles by Tag #monitoring
Browse our collection of articles on various topics related to IT technologies. Dive in and explore something new!


AWS DevOps Project: Advanced Automated CI/CD Pipeline with Infrastructure as Code, Microservices, Service Mesh, and Monitoring
Introduction In this advanced AWS DevOps project, we will build a sophisticated CI/CD...

DevOps Project: High Level Monitoring Project in DevOps
Introduction Monitoring is a crucial aspect of the DevOps lifecycle, ensuring that your...


Monitoring Go Applications Using Prometheus, Grafana, and Docker
Monitoring is important for any application. It helps us ensure that our application is running...


Simplify Kubernetes Monitoring: Kube-prometheus-stack Made Easy with Glasskube
What do we, as developers and engineers, value most above all else? The answer is simple: our...


Database Monitoring: Importance, Tools, and Best Practices for Performance Optimization
Database Monitoring: Importance, Tools, and Best Practices for Performance Optimization. ...


Monitoring Solutions: Prometheus and Grafana
_In modern cloud computing, monitoring solutions are vital to ensuring the reliability, availability,...


Network Observability: Beyond Metrics and Logs
These days, when you want to discuss tracking the state, stability, and overall performance of your...


Getting Started with Prometheus and Grafana in Java
Monitoring is a crucial aspect of application performance management. As applications scale, ensuring...


How Our Infrastructure Supports Last-Minute Studying
The past few weeks, one of our clients, Astra AI - an AI powered math tutor, has been recording a...


Monitoring & Logging in DevOps: Tools and Best Practices
Introduction Imagine you are running a large-scale e-commerce website, and suddenly, your...


How to Score 93% in the Prometheus Certified Associate Exam
Introduction Passing technical certifications often feels daunting and intimidating. The...
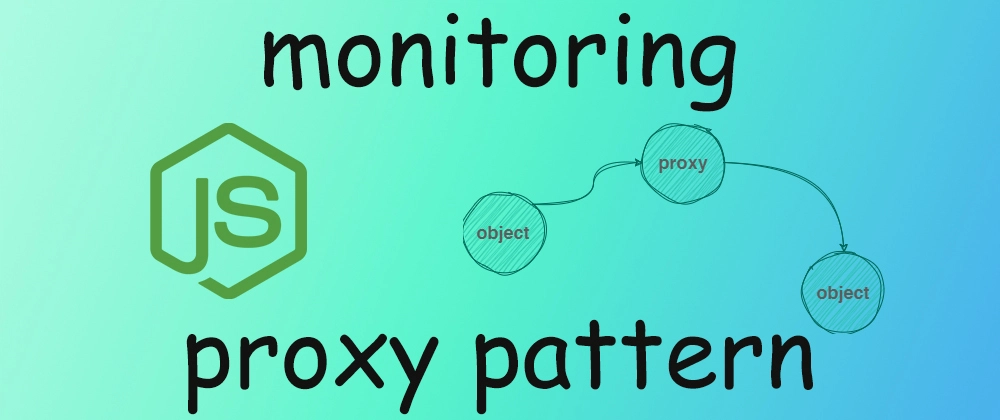

Monitoring using Proxy Design Pattern with Node.js
Introduction why we need monitoring? Imagine you have multiple machines (servers) running...


How to Check Fragmentation in an Oracle Database
Database fragmentation can significantly impact performance, leading to slower queries and...


Managing Azure Arc-Enabled Windows Server Updates by Using Azure Update Manager
Introduction In our previous guide, we used Insights to monitor our Azure Arc-enabled...


AWS ALB(Ingress) access logs on Grafana
Hi 👋, we shall explore the following use case in this post: Let's say you have an EKS cluster, and...


How to Handle Alert Fatigue
A very important aspect for many developers and DevOps is handling alerts. An even more important and...
![[Open Source] Simplify Metrics Reporting in NestJS with a Zero-Dependency-Injection Global Reporter](https://media2.dev.to/dynamic/image/width=1000,height=500,fit=cover,gravity=auto,format=auto/https%3A%2F%2Fdev-to-uploads.s3.amazonaws.com%2Fuploads%2Farticles%2Fw960hjlyd2wbxdptsb3j.png)

[Open Source] Simplify Metrics Reporting in NestJS with a Zero-Dependency-Injection Global Reporter
Hey everyone! 👋 I'd like to share an open-source package I recently developed called...


Monitor EC2 memory and disk with CloudWatch Agent🕵🏽
🚀 CloudWatch Agent Setup on AWS EC2: Collect Memory & Disk Metrics 🖥️📊 In this guide, you'll...


Day 14: Advanced Logging and Monitoring with Prometheus, Grafana, and Alertmanager (Termux Edition!)
Introduction Today, we will look deep into the world of advanced logging and monitoring, but with a...


Building a Docker-based Monitoring & Alerting System with Prometheus and Grafana (part-1)
Keeping your systems healthy is vital, and nothing beats being the first to know when something goes...


The Must-Have GitHub Actions Dashboard - CICube
Well, we wanted to let you know about one thing we've been working on: CICube, the platform...

DevOps Made Simple: A Beginner’s Guide to Log Management in DevOps - ELK Stack vs Loki Stack
Introduction Log management is a crucial part of DevOps that helps teams monitor,...


Prometheus + Redis: Simple Guide to Monitor Redis Instances
Redis is often a critical part of modern infrastructure — whether used as a cache, message broker, or...


Prometheus Architecture: Understanding the Workflow 🚀
Have you ever used Prometheus for monitoring systems? It’s great at collecting and storing metrics,...

Introduction to OpenTelemetry: A DevOps Beginner's Guide
As a DevOps engineer, understanding how your applications are performing in production is crucial to...

OTEL Auto Instrumentation Demo for SpringBoot
Hello 👋, this post is about auto instrumenting a spring boot app with the otel agent running on EKS,...


Dockerized Deployment of a Full Stack Application with Reverse Proxy, Monitoring & Observability
The goal here is to provide a robust and scalable application infrastructure while showcasing best...

How to Set Up Prometheus Exporters for PostgreSQL and MongoDB in Kubernetes
If you're running PostgreSQL and MongoDB databases in your Kubernetes cluster, monitoring them...


How to Monitor Nginx Logs with Grafana, Loki & Promtail on Docker
Introduction We will follow the flow of the Nginx logs data until it is displayed in...


Using Helm Chart to Deploy Grafana, Prometheus, and Loki Data Source on Your Kubernetes Cluster
Deploying observability tools like Grafana, Prometheus, and Loki in a Kubernetes environment can seem...